Posts by briansia (8)

Resource Monitoring for Developers

Motivation

For computationally intensive tasks, monitoring the workstation's resource usage is important. Said workloads can range from gaming, to high performance computing, or training deep learning models.  Knowing how much CPU/GPU/RAM/network bandwidth is used can tell developers if their machines can handle the workload. If necessary, the developers can modify their code to reduce resource usage, or add more hardware to accomodate for the heavier load.

Monitoring Tools

Depending on the platform, different built-in solutions are offered. Linux users have the GNOME System Monitor, Windows users have Task Manager, and Mac users have Activity Monitors. Sadly, these off-the-shelf solutions share a few problems. They are quite inaccurate, their graphical interfaces are unfriendly, and their logs cannot be exported.

These tools are useful for taking a quick glance at the resource usage. Serious developers, however, would require more than basic tools. They often have to export their findings and share it with their colleagues.

Third Party Alternatives

There are many third-party tools catering to various platforms and needs. For example, GPU-Z for monitoring NVIDIA chips or s-tui for graphical monitoring on Linux terminals. My personal favorite monitoring tool by far is netdata

A look at the powerful Netdata

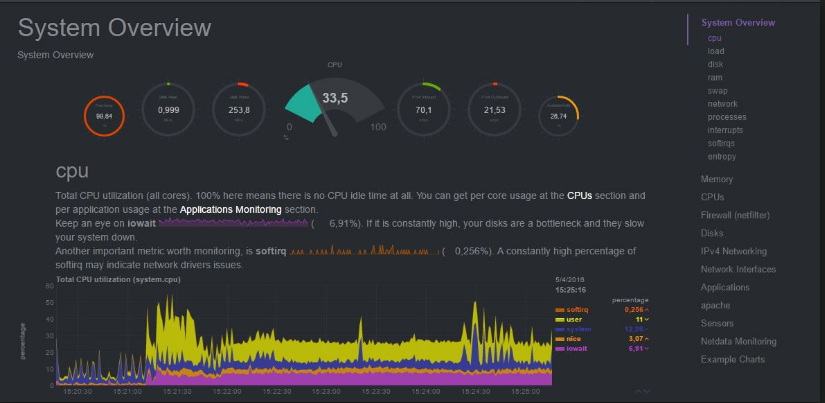
Netdata is a powerful open-source tool designed to collect a plethora of real-time metrics, and then displaying them on aesthetically pleasing, easy-to-interpret graphs and charts. Unfortunately, Netdata is not supported natively on Windows. Netdata's engineers decided to focus their effort on Linux, since that is what the vast majority of the production systems use. Windows developers have to jump through a bunch of hoops to use netdata with Windows (Just hop onto the Linux bandwagon already. Why would anyone still run production systems on Windows?). In the future, a whole post may be dedicated to just exploring Netdata.

I hope this post introduced you to some monitoring tools. If there is any takeaway, it is for developers to move away from built-in monitoring tools and adopt better third-party solutions. Feel free to share other monitoring tools that you used for your job.

Happy monitoring! 


Learning Flask With a Personal Project

What is Flask?

Flask is a web framework written in Python. It is a microframework that does not require particular tools or libraries. As such, Flask does not come with database abstraction layer, form validation nor any other components, unlike Django. Flask and Django are the most popular Python webdev frameworks, so supports for both are extensive.

Flask Components

Flask operates with these components.

- Werkzeug, a toolkit for Web Server Gateway Interface (WSGI)

- Jinja, a template engine for displaying Python variables in markup

- MarkupSafe, a string handling library that escape characters so it is safe to use HTML and XML

- ItsDangerous, a data serialization library used to store Flask app sessions without allowing users to tamper with session contents

Toy Project – Pack Cracking Simulator

The toy project is a simple web application that simulates the opening of a card game booster pack, or colloquially called ‘pack cracking’. A Magic: The Gathering pack (only the best trading card game in the world) is cracked open, revealing 16 cards. A standard MTG pack (not counting special products) will contain 1 rare or mythic rare card, 3 uncommon cards, 11 common cards, and a token card. Promotional cards are not counted since they do not provide any gameplay value.

Setting Up the Flask Project

Setting up a Flask project can be a daunting task for new web developers who are not familiar with the Flask project structure. Instead, running a boilerplate generator is faster and much more convenient. The one used in this project is https://github.com/isakal/create-flask-app, a Flask version of the popular Create React App generator. Spending time for development is much more productive than spending time on project configuration.

Card Data Request

Card data is acquired using the Scryfall API. Scryfall is the most well known search engine for Magic: the Gathering cards. Requests for sets and individual cards can be performed by following the request format stated in the docs. The response will be returned as JSON blobs.

As per usage policy, each request comes with a 50 milliseconds delay so that the Scryfall server does not experience heavy load.

Since all request information can be contained inside the URL, all Scryfall requests are GET requests.

Request Caching

Sending a set request to the Scryfall API, getting the JSON blob and rendering the cards takes around 12 to 20 seconds, which is quite slow for a simple app. Caching the requests would bypass the need for the application to fetch data from Scryfall’s server. With the cache, the first request takes more time, but subsequent requests of the same set would take a mere fraction of a second.

Since this is a simple app, there is no need for long term storage nor a sophisticated caching policy. Setting request TTLs to one day will wipe out stale data.


Architecture


The application works as follows:

1.) The user selects the set with the interface.

2.) The application sets a get request to the Scryfall API.

3.) If the GET request is cached, get the JSON blob from the cache, send it to the web server,

and render the cards on the browser. Else, get the data from the server, cache the request, and send the data to the web server before rendering it on the browser.

Sample Output